Does Australia’s productivity growth slowdown represent an inflation risk?
The Australian Economy | 14th December 2023
One of the many interesting things you can do with the information provided in the Australian Bureau of Statistics’ Labour Account, the most recent of which (for the September quarter) was published last Friday, is derive what I call ‘dollar-based’ estimates of labour productivity – not only for the economy as a whole, but for industries and for states.
That’s in contrast to the way the ABS has traditionally presented productivity estimates (as in the quarterly and annual national accounts, and in its productivity publications), as index numbers (set to 100.0 in the base year for the national accounts, currently 2021-22).
Index numbers are fine for calculating rates of growth in labour productivity over time – which is all many of the users of these statistics want to do.
But precisely because they are all set to 100.0 in the base year of the national accounts, they cannot be used for comparing levels of labour productivity across different industries, or across states and territories, as I often want to do.
So, for example, you can divide the estimates of gross value added by industry, published in the quarterly national accounts, by the estimates of hours worked by industry published in the labour account, to derive estimates of gross value added per hour worked – ie for labour productivity, expressed in dollars – for each industry.
Chart 1 shows these estimates of labour productivity for the most recent financial year, 2022-23, ranked in descending order.
Chart 1: Gross value added per hour worked, by industry, 2022-23
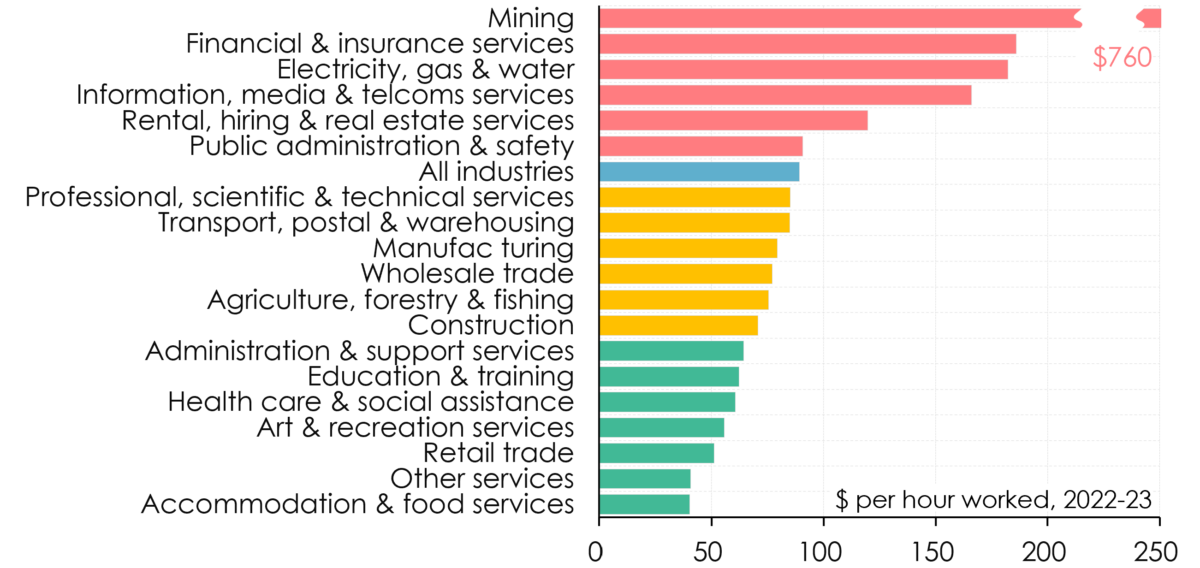
Sources: ABS, Australian National Accounts: National Income, Expenditure and Product and Labour Account, September quarter 2023.
Labour productivity in mining is more than ten times higher than the average for all other industries combined – reflecting the fact that it is highly capital-intensive (the mining industry produced 13% of Australia’s GDP in 2022-23 using 23½% of the nation’s non-residential capital stock but employing only 2% of the workforce.
Five other sectors – finance and insurance services; utilities; information, media and telecommunications; rental, hiring and real estate services; and public administration and safety – also have above-average levels of labour productivity, reflecting their capital intensity, or their above-average use of skilled labour.
At the other end of the spectrum, two industries – accommodation and food services, and ‘other services’ (which includes things such as repair and maintenance activities, hair, beauty and diet services, and religious, civic, professional and other interest group services) – have levels of labour productivity which are less than half the national average. The level of labour productivity in five other intrinsically labour-intensive industries – such as retail trade, art and recreation services, health care and social assistance, education and training, and administration and support services – is between 25% and 50% below the average for all industries.
It’s interesting to note that labour productivity in manufacturing is some 11% below the all-industry average. That means that policies based on what I sometimes call “manufacturing fetishism” – the apparent belief that there is something inherently more noble, or worthwhile, about manufacturing than other forms of economic activity – will, to the extent that they result in the manufacturing sector being larger than it would be otherwise, tend to drag down Australia’s overall level of productivity.
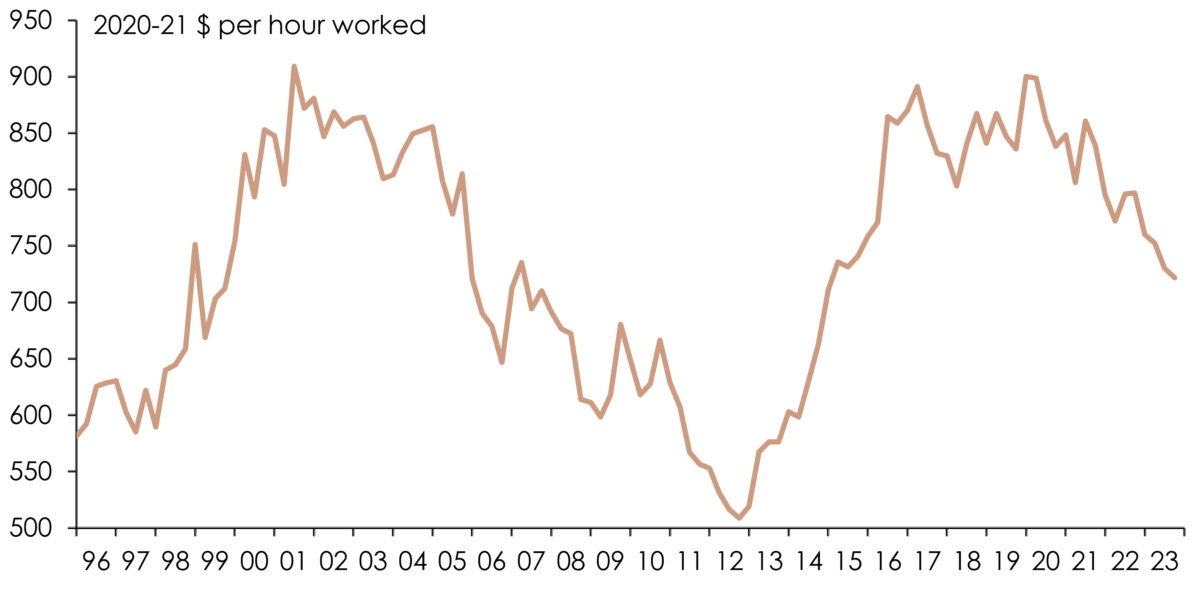
Australia’s labour productivity growth rate slowed substantially after the end of the mining investment boom a decade ago, and after a brief spurt during Covid has since turned negative – that is, the level of labour productivity has fallen. Both my dollar-based measure of labour productivity and the ABS index measure tell the same story (Chart 2).
Chart 2: Labour productivity growth, 1996-2023

Sources: ABS, Australian National Accounts: National Income, Expenditure and Product , September quarter 2023.
Nearly all ‘advanced’ economies experienced a slowing in labour productivity growth between the global financial crisis of 2007-09 and the onset of the Covid pandemic. I’ve found the explanations for this proffered by Australia’s Daniel Andrews and fellow researchers (for example here from a global perspective, or here from an Australian standpoint) persuasive: that there’s been a slowdown in the ‘diffusion’ of new technologies from ‘frontier firms’ (which invent them) to ‘laggard firms’ (which copy, adapt and use them), partly as a result of the greater market power which the former now have; and that there has been a decline in ‘economic dynamism’ across ‘advanced’ economies (including Australia) as evidenced by lower rates of business entry and exit, and lower rates of job-switching by workers. Other plausible (though at best partial) explanations include lower levels of business investment, and (in Australia) a dearth of productivity-enhancing reforms, especially by comparison with the second half of the 1980s and the 1990s.
However Australia’s more recent productivity slump is unusual. It’s been much more pronounced than in the US (see Chart 3) or other ‘advanced’ economies.
Chart 3: Labour productivity growth, Australia and United States
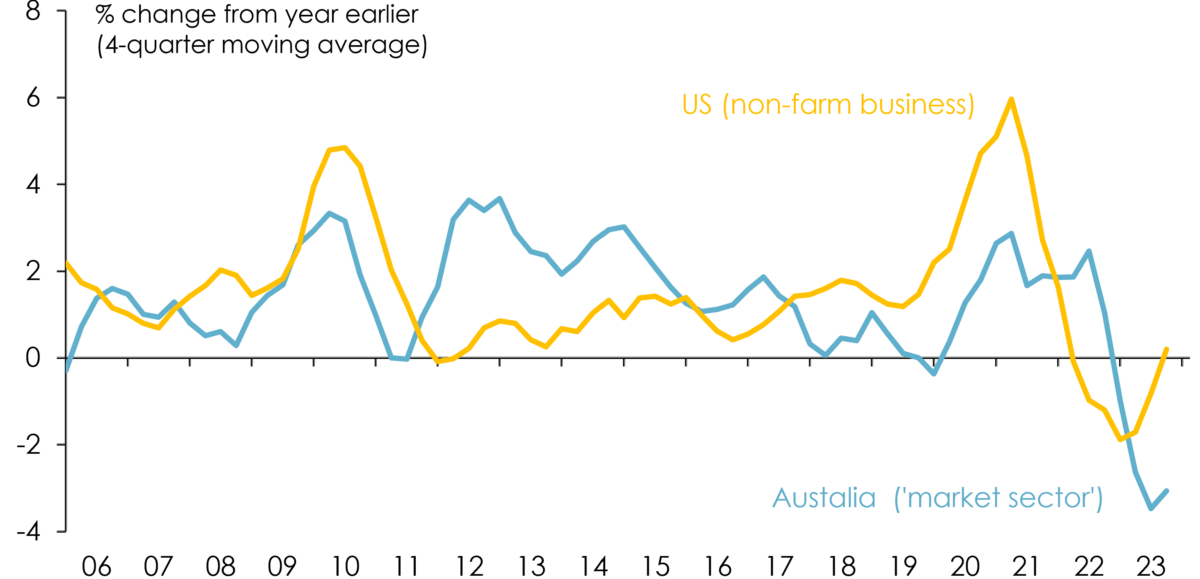
Sources: ABS, Australian National Accounts: National Income, Expenditure and Product , September quarter 2023; US Bureau of Labor Statistics, Productivity and Costs, Third Quarter 2023.
The dollar-based productivity estimates can be used to shed some additional light on the reasons for the slowdown in Australia’s labour productivity growth rate both in the years between the peak in the mining investment boom and the onset of Covid, and over the past year.
There’s been a noticeable shift in the composition of Australian economic activity towards industries in which (as shown in Chart 1) have below-average levels of labour productivity: and, to a lesser extent, a shift away from industries with above-average levels of labour productivity:
- between 2011-12 and 2019-20, the proportion of total hours worked in the Australian economy which were worked in the seven sectors where the level of labour productivity is more than 35% below the all-industry average rose by 2.3 percentage points (from 41.8% to 44.1%), while the share of total hours worked which were worked in the six sectors where the level of labour productivity is above the all-industry average fell by 0.5 of a percentage point (from 16.3% to 15.9%);
- after temporarily reversing during the Covid-pandemic, the share of total hours worked which were worked in ‘low labour productivity industries’ rose from 43.4% in the September quarter of 2021 to 45.5% in the March quarter of 2023 (an increase of 1.1 percentage point), while the share of total hours worked which were worked in ‘high labour productivity industries fell from 16.9% to 16.0% (a drop of 0.9 of a percentage point) over the same period; the proportions have changed little (on net) over the June and September quarters of 2023.
These shifts in the composition of hours worked are depicted in Chart 4.
I’m not suggesting that this shift in hours worked from high- to low-labour productivity industries ‘explains’ all of the slow-down in labour productivity growth in the pre-Covid years, or the decline in the level of labour productivity since the end of the pandemic.
Chart 4: Hours worked in ‘high’- and ‘low’ labour productivity industries as a pc of total
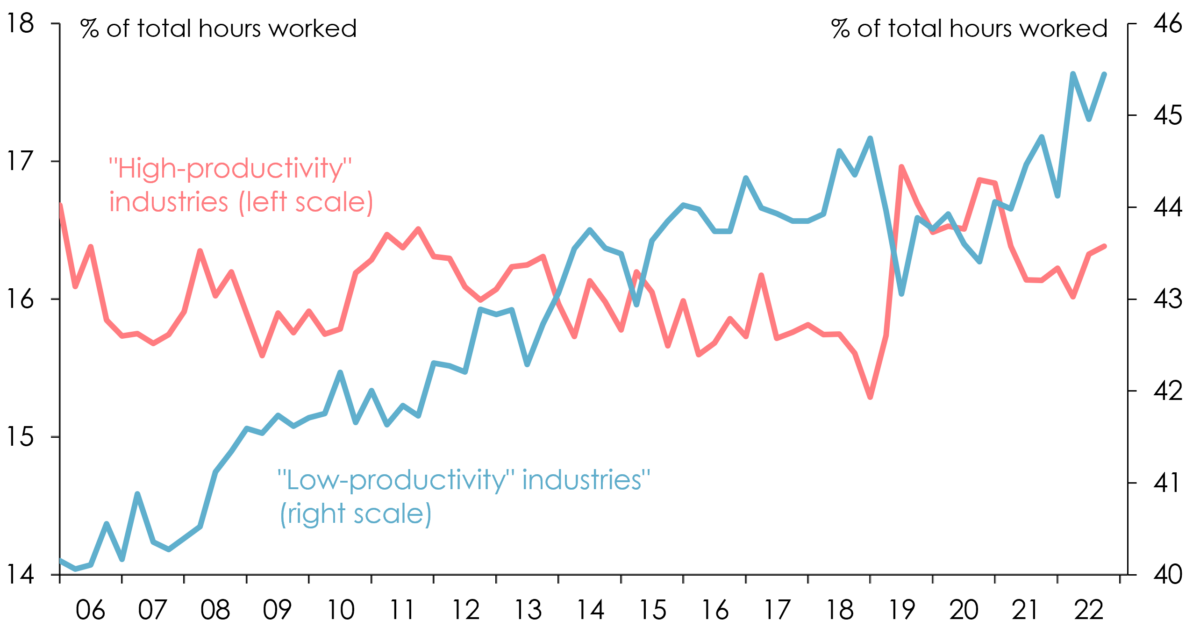
Note: ‘High-productivity industries’ are mining; financial & insurance services; electricity, gas, water & waste management services; information, media & telecommunications services; rental, hiring & real estate services; and public administration & safety. ‘Low-productivity industries’ are administrative & support services; education & training; health care & social assistance; art & recreation services; retail trade; other services; and accommodation & food services. Sources: ABS, Australian National Accounts: National Income, Expenditure and Product and Labour Account, September quarter 2023.
Labour productivity growth in intrinsically high-productivity industries slowed significantly between 2013-14 and 2018-19, and has been negative (that is, the level of labour productivity has fallen outright) since the December quarter of 2020; while labour productivity growth in low-productivity industries has also been negative since the December quarter of 2022 (Chart 5).
Chart 5: Labour productivity growth in ‘high’- and ‘low’ labour productivity industries
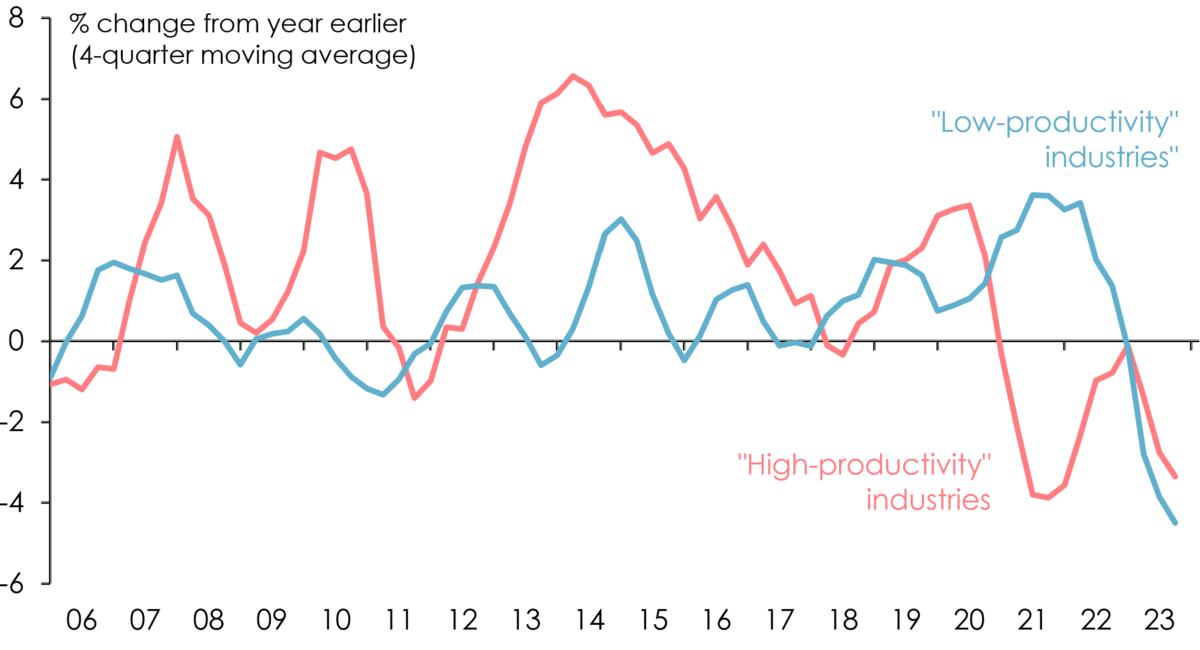
Note: High- and low-productivity industries are as in Chart 4. ABS, Australian National Accounts: National Income, Expenditure and Product and Labour Account, September quarter 2023.
.
In particular, something odd appears to be happening with labour productivity in the mining sector – the level of which has dropped by almost 20% since the December quarter of 2019 (Chart 6). Between then and the September quarter 2023, hours worked in mining rose by 19.6% (almost all of which was attributable to an increase in the number of people employed in the mining sector, rather than an increase in average hours worked), whereas the volume of mining industry output (chain volume gross value added) fell by almost 2%.
Chart 6: Labour productivity in mining
Sources: ABS, Australian National Accounts: National Income, Expenditure and Product and Labour Account, September quarter 2023.
Something similar happened between 2001 and 2008, when labour productivity in the mining sector declined, at its greatest extent, by almost 33%. Perhaps not co-incidentally, this was also a period in which, like the past four years, mining companies have benefited from unexpectedly high commodity prices without increasing output. The decline in mining industry labour productivity between 2009 and 2012 is more readily explained by the significant expansion in mining industry capacity during this period, and the inevitable lags between increased employment and investment in such huge projects and the subsequent increase in production.
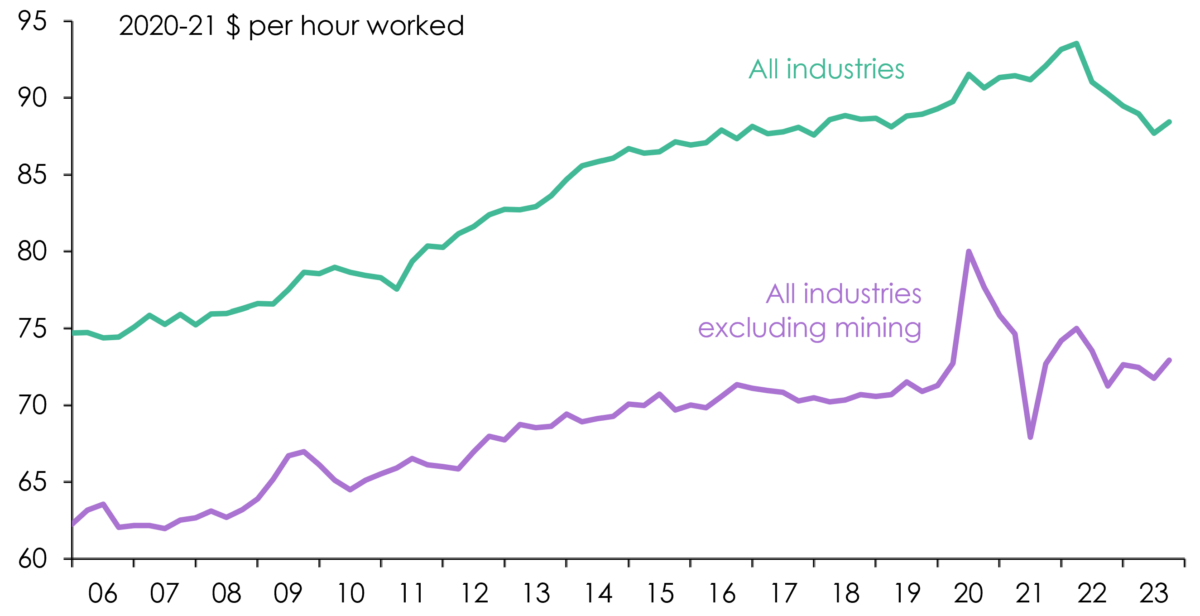
The decline in the level of labour productivity in the mining sector has had a material impact on overall labour productivity – something which can be discerned from dollar-based measures of labour productivity but not from the published ABS indices. The level of labour productivity across the Australian economy as a whole has fallen by 0.9% since the December quarter of 2019. But excluding the mining sector, the level of labour productivity has risen by 2.3% (Chart 7): although non-mining sector labour productivity is also, as of the September quarter just gone, below its (probably Covid-distorted) peak in the second half of 2020.
Put differently, labour productivity growth for the economy as a whole since the December quarter has been -0.3% per annum, comprised of -5.7% pa in the mining sector and +0.6% pa in the non-mining sectors as a group.
That latter figure is of course still well below the average of 1.6% pa over the nine years to the end of 2019. But the shift towards low-productivity industries probably explains a good deal of that.
Chart 7: Levels of labour productivity in mining and non-mining sectors
Sources: ABS, Australian National Accounts: National Income, Expenditure and Product and Labour Account, September quarter 2023.
The Reserve Bank has repeatedly expressed its concern (for example in its most recent Statement on Monetary Policy) that if productivity growth remains subdued, labour costs would likely become an additional source of inflationary pressure, “requiring a prolonged period of below-trend growth, and lower employment, to reverse”.
However, to the extent that the slowdown in productivity growth is attributable to the mining sector, whose products are, for the most part, not reflected in the consumer price index, persistently below-historical-average rates of productivity growth may have fewer consequences for inflation.
Similarly, to the extent that the slowdown in productivity growth is attributable to an ongoing shift in the composition of economic activity towards intrinsically low labour productivity industries – something which seems likely to continue over the medium term as the demand for health, aged and disability care rises – it may be less inflationary than a sustained slowdown in labour productivity growth in sectors such as retail and wholesale trade, transport and storage, manufacturing or construction would be, because many of these services are funded by taxes rather than via consumer payments for which there is a readily identifiable price.
None of that alters the fact that persistently slow growth in labour productivity, for whatever reason, makes sustained increases in real wages or in broader measures of material living standards less likely. Nor does it in any way detract from the desirability of governments pursuing a range of productivity-enhancing reforms – as for example recommended by the Productivity Commission in its quinquennial Productivity Inquiry Report, Advancing Prosperity, published in March this year – or from the owners and managers of businesses striving harder for productivity improvements at the enterprise or workplace level.